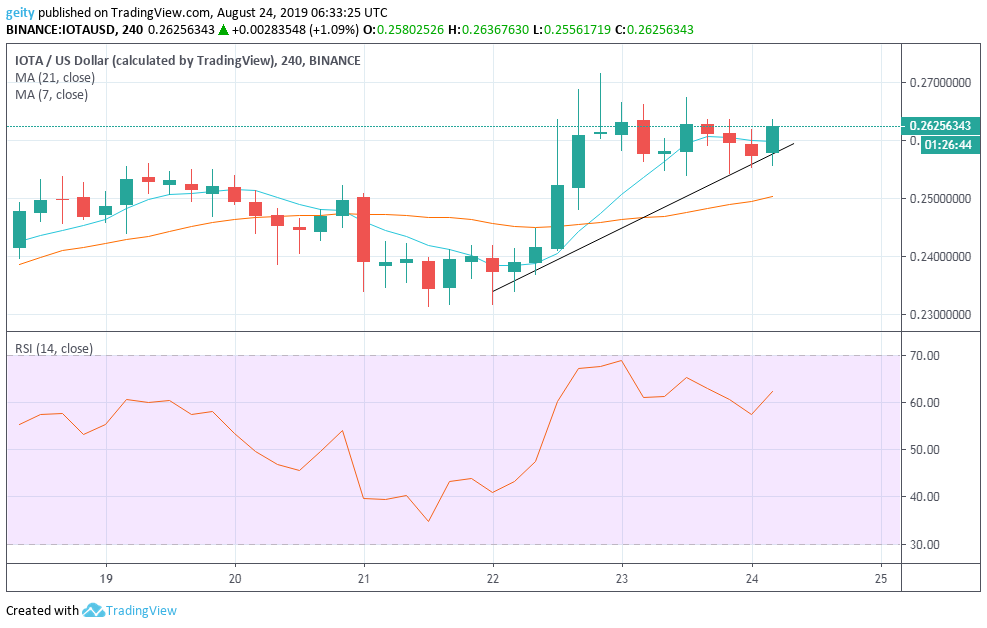
Over the last 5 day of trading, the market of IOTA/USD pair has exhibited a strong bullish outlook on a 4hr time frame. The bulls seemed to have been dominating the momentum as the volatility is getting higher. The upside move shifted the price action from a critical support level of $0.23423 to $0.25647. Additionally, a struggle to break past $0.26379 resistance level was observed, but the bulls seemed to have failed to manage. However, the ascending triangular pattern that has formed during the last 2 days suggest further uptrend.
The price is most likely to bounce back up from $0.25647 and break the $0.26000 since the Moving averages suggest a continuation of a bullish outlook. The RSI indicator that is currently trading on a upward direction has also signaled a continuation of an upside price rally. Conversely, if the price breaks the support level, then a downside move may come into action, with support level dropped near $0.25000 and $0.24000.
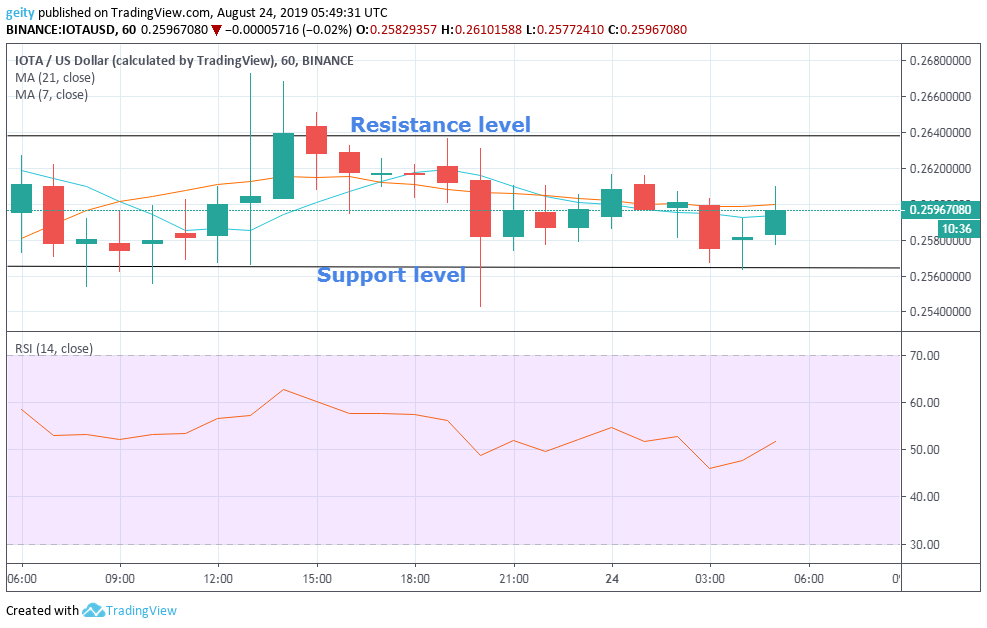
On the hourly chart, IOTA/USD pair has been facing a mixed price reaction. The current price of IOTA/USD is changing hands at $0.25969and over the last 24hrs the trend has been hovering horizontally between $0.26386 and $0.25645 the resistance and support levels respectively.
The moving averages have intertwined severally that confirmed a sideways trend. The RSI indicator is currently trading between level 40 and 60 that signal a lack of dominance; thus, there is equality between buyers and sellers in the market momentum. Presence of Doji candles was also seen repeatedly, that confirmed the indecision in the market.
The price of IOTA is currently by market capitalization to the tune of $6.31 million with a circulating supply of $2,779,530,283. The RSI indicator is presently pointing north, that anticipate a bullish outlook in the near term. If the bulls up their game and manage to break past the $0.26400 level, then an upward rally near $0.29000 should be anticipated.
Cryptocurrency Charts By Tradingview
Disclaimer: This is not trading or investment advice. The above article is for entertainment and education purposes only. Please do your own research before purchasing or investing into any cryptocurrency or digital currency.
At the latest “SEC Speaks in 2026” event, the U.S. Securities and Exchange Commission made…
Morgan Stanley is edging further into the crypto space after filing a second amended S-1…
Ethereum co-founder Vitalik Buterin is once again stirring conversation across the crypto space, this time…
The way money moves is starting to change and it’s not happening slowly anymore. What…
Ondo Global Markets just leveled up its onchain presence again, rolling out over 60 new…
Bootstrapped Project Processes $5M in Trading Volume Within Two Weeks, Proving Viability of ALM…